  treat nitrogen block height weight leaf_area shoot_area flowers
1   tip   medium     1    7.5   7.62      11.7       31.9       1
2   tip   medium     1   10.7  12.14      14.1       46.0      10
3   tip   medium     1   11.2  12.76       7.1       66.7      10
4   tip   medium     1   10.4   8.78      11.9       20.3       1
5 tip medium 1 10.4 13.58 14.5 26.9 4Intro to R with RStudio
About this workshop
For novice or inexperienced coders that want to use R. We will use RStudio to learn:
- How to use and write basic functions.
- How R stores and handles different types of data.
- Basic ways to create, manipulate, import, clean, and summarize data.
- But NOT statistical modeling.
Workshop format
- From 1 to 4:45 pm.
- Breaks every 90 minutes.
- A few slides for context and extra information.
- A lot of hands-on coding and live demonstrations.
- All materials will be available after the workshop ends.
Tips for this workshop
- Coding along with me is the best way to learn.
- Ask questions at any time.
- During exercises, interact with your peers.
What is CSCAR?
- Full name: Consulting for Statistics, Computing and Analytics Research.
- A unit of the Office of the Vice President of Research (OVPR).
- Guides and trains researchers in data collection, management, and analysis.
- Also helps researchers to use technical software and advanced computing.
CSCAR is here to help you
- Free, one-hour consultations with graduate-level statisticians.
- GSRAs are available for walk-in consultations Monday through Friday, between 9am and 5pm (we close on Tuesdays between noon and 1pm).
- All of our scheduled appointments can be either remote or in-person.
Contact CSCAR
- To request a consultation: email deskpeople@umich.edu, or fill this form. Or visit cscar.research.umich.edu.
- Self-schedule a consultation with a GSRA using this link.
- Address: The University of Michigan, 3560 Rackham, 915 E. Washington St., Ann Arbor, MI 48109-1070.
Who am I?
- Abner Heredia Bustos, a data science consultant at CSCAR.
- I want to make coding as simple and effortless as possible…
- …which means learning it well from the beginning.
Why do you want to learn R?
R is cheap and powerful
- R is gratis ($0) and it runs on Windows, MacOS, and several Unix platforms.
- You can start with this:
and, in 8 lines of code or less, make this:

R is an environment, not a package
- A package is a fixed set of tools.
- An environment is for combining, modifying, and creating tools.
R has plenty of statistical tools and models
- Generalized linear models (including linear regression).
- Survival analysis.
- Time series analysis.
- Multilevel models.
- Classification and clustering.
- Sample size and power calculations.
- Multivariable analysis (e.g., factor analysis, PCA, and SEM).
Even more tools and models
- Users constantly publish their own code packages: more than 13 thousand in the Comprehensive R Archive Network (CRAN) as of March 2019.
- Many complex statistical routines are not (and may never be) available in other statistical software.
Why Isn’t Everyone a UseR?
- Some people only use the software they learned first, which is not always R.
- Each package in R has its own rules to learn.
- Help pages and error messages may be hard to understand.
Suggestions for Learning R
- Learn interactively.
- Don’t worry about getting errors.
- Ask other R users for help.
Some useful links
- https://www.r-project.org: Here you will find links for downloading R, downloading additional packages for R, and more.
- https://cran.r-project.org/web/views/: Summaries of important packages by subject field or analysis type.
- https://journal.r-project.org: The R Journal.
- https://stats.stackexchange.com: Cross-Validated.
- https://www.r-bloggers.com
More useful links
- https://stats.idre.ucla.edu/r/: Institute for Digital Research and Education at UCLA.
- https://socialsciences.mcmaster.ca/jfox/: John Fox’s home page.
- https://sas-and-r.blogspot.com/: Examples of code to perform same task in SAS and R.
Let’s start coding
Practice your arithmetic
Think of an integer, double it, add six, divide it in half, subtract the number you started with, and then square it. If your code is correct, the answer should be nine.
Object names have rules
- Names can be a combination of letters, digits, periods
.and underscores_. - Names can not include white spaces.
- If a name starts with a period
., it can not be followed by a digit. - Names can not start with a number or an underscore
_.
Object names have rules
- Names are case-sensitive (
age,AgeandAGEare three different objects). - Reserved words (
TRUE,FALSE,NULL,if, …) can not be used as names
Tips for naming objects
- Avoid giving your object the same name as a built-in function.
- To separate words, use an underscore (
my_object) or a dot (my.object), or capitalize the different words (MyObject). Choose your favorite way, but be consistent with it. - Use names that illustrate what you want to do with the objects.
Exercise
Write a function that can simulate the roll of two six-sided dice, one red and one blue, an arbitrary number of times. This function should return a vector with the values of the red die that were strictly larger than the corresponding values of the blue die.
Exercise step by step (part 1)
- Step 1: define a function that takes one argument,
num_rolls, representing the number of times to roll the dice. - Step 2: create two objects called
redandblueto store the results from the dice rolls. - Step 3: simulate the dice rolls using function
sample()(read its help page if you need to).
Exercise step by step (part 2)
- Step 4: create a vector of indices that identifies the values in the red die that were larger than the values in the blue die.
- Step 5: use this vector of indices to extract the values from the red die.
- Step 6: make sure that your function returns the values you extracted in step 5.
Coercion
When adding different data types to the same atomic vector, R follows specific rules to coerce everything to be of the same type.
- If a character string is present in an atomic vector, R will convert all other values to character strings.
- If a vector only contains logicals and numbers, R will convert the logicals to numbers; every
TRUEbecomes a1, and everyFALSEbecomes a0. NAs are never coerced automatically.
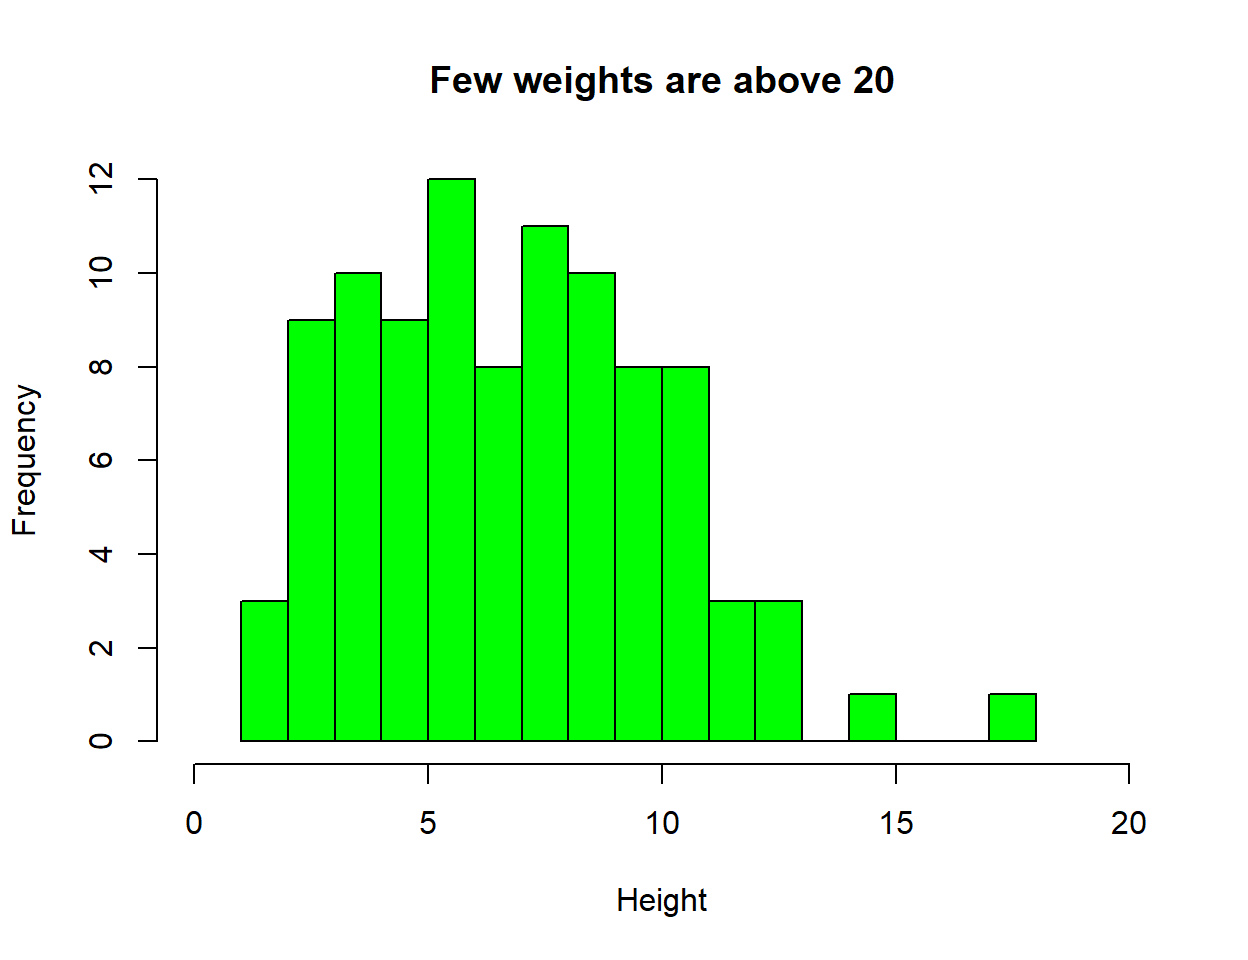
Make a histogram
Use the example I showed to you to make a histogram for variable height. Bonus: can you color the bars?
Your histogram result should resemble this one:

Here is the code for the histogram:
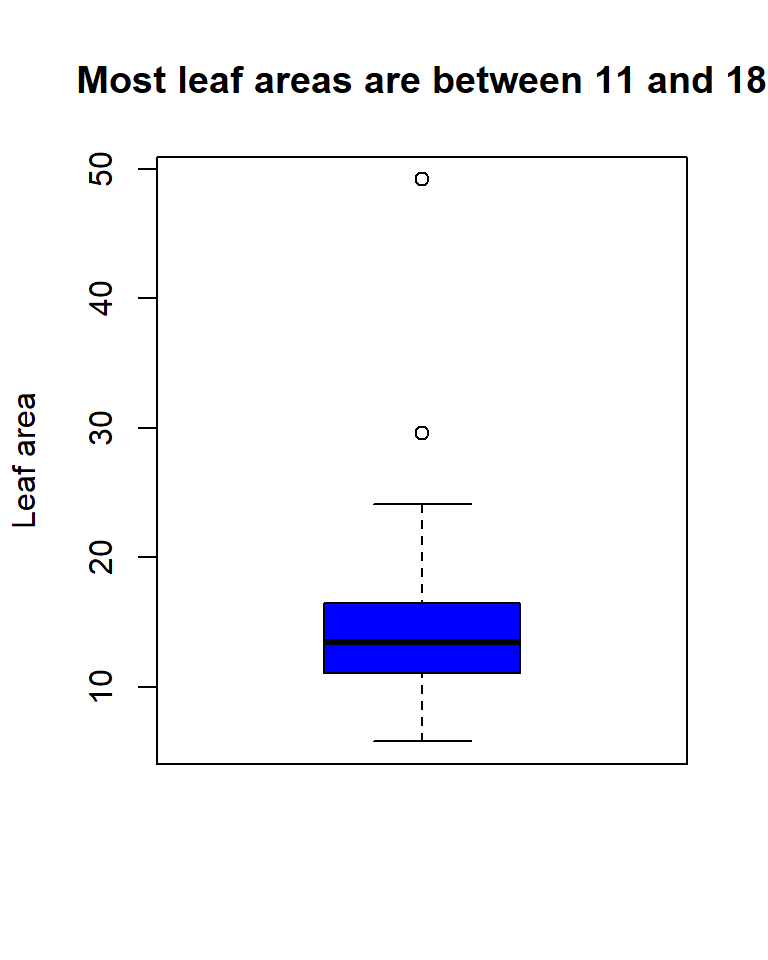
Make a boxplot
Use the example I showed to you to make a histogram for variable leaf_area. Bonus: can you color the box?

Here is the code for the boxplot.
Make a scatterplot
Use the example I showed to you to make a scatter plot with height and weight, coloring by nitrogen level. Remember to add a legend to the plot. Your scatter plot should resemble this one:

Here is the code for the scatter plot.
plot(
    x = flower_df$weight,
    y = flower_df$height,
    col = flower_df$nitrogen,
    main = "No clear association between height and weight",
    xlab = "Weight",
    ylab = "Height"
)
# Add a legend to the plot
legend(
    x = "bottomright",
    legend = levels(flower_df$nitrogen),
    col = 1:length(levels(flower_df$nitrogen)),
    pch = 16
)
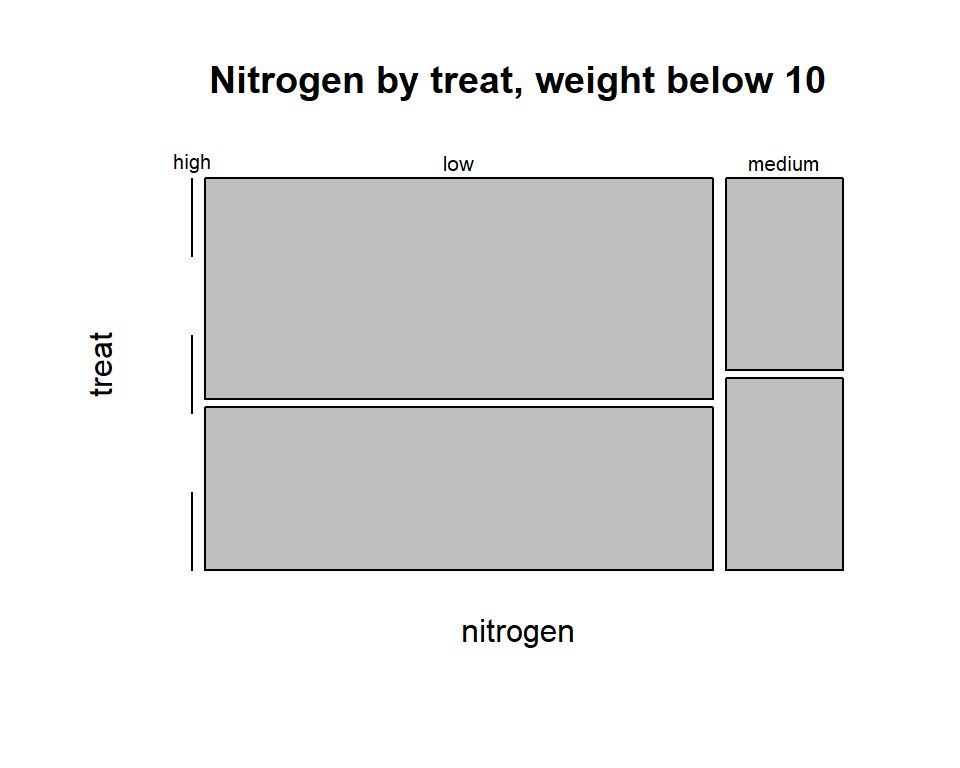
Make a mosaic plot
Use the example I showed to you to make a mosaic plot to visualize how frequently the values of nitrogen and treat combine with each other, but only for flowers with a weight below 10. Your plot should resemble this:

Here is the code for the mosaic plot