3 Understanding Data Management Tasks
Data for this section: section3_data.sav
3.1 Sorting Cases
Sorting cases based on a particular variable is often necessary when managing data sets. Go to Data -> Sort Cases to place the cases in order. Choose the variable that determines the ordering, and choose “Ascending” or “Descending”.
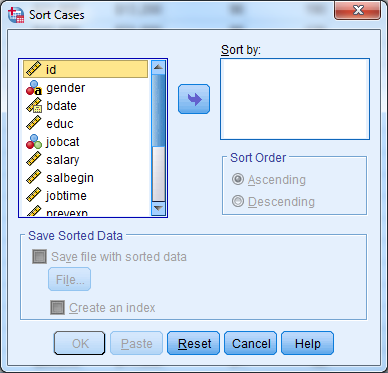
Selecting the ID variable and choosing “Ascending” will place the subject with the smallest ID number in the top row. The bottom row will contain data on the subject with the largest (highest) ID number.
When sorting by more than one variable, SPSS sorts the data initially based on the first variable. Within each value of that first variable, it sorts again based on the second variable. Make sure to select “Ascending” or “Descending” for each variable when you are sorting by multiple variables. Highlight the variable by clicking on it, and choose the correct ordering.
Suppose we want to sort by gender and then by age, with both in ascending order. Suppose the codes for gender are as follows:
- 0: male
- 1: female
SPSS would first put males at the top of the file and females at the bottom. SPSS would then sort by age within each gender group. The first rows of the data set would contain the youngest men in the sample and the last subjects at the bottom would be the oldest women in the sample.
3.2 Analyzing Subsets of Data
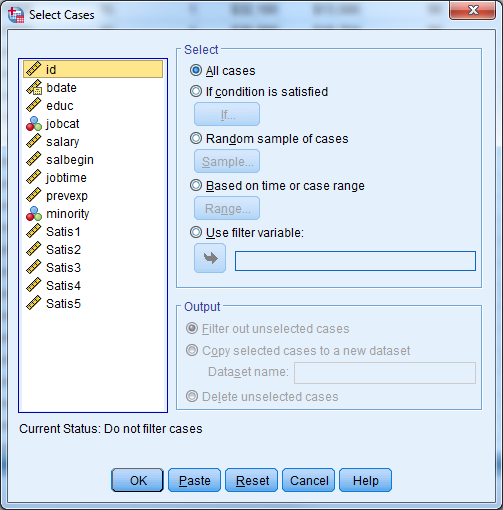
You can use the “Select Cases” command to instruct the software to calculate statistical results or summaries based on only some of the cases in the data set. You can define the subset by certain characteristics, such as women over age 40, or you can instruct the software to select a random sample of cases with size that you specify.
Note: The Select Cases procedure affects which cases that SPSS includes in analysis and output only. It has no effect on transformations of the data, such as computing, recoding, or counting.
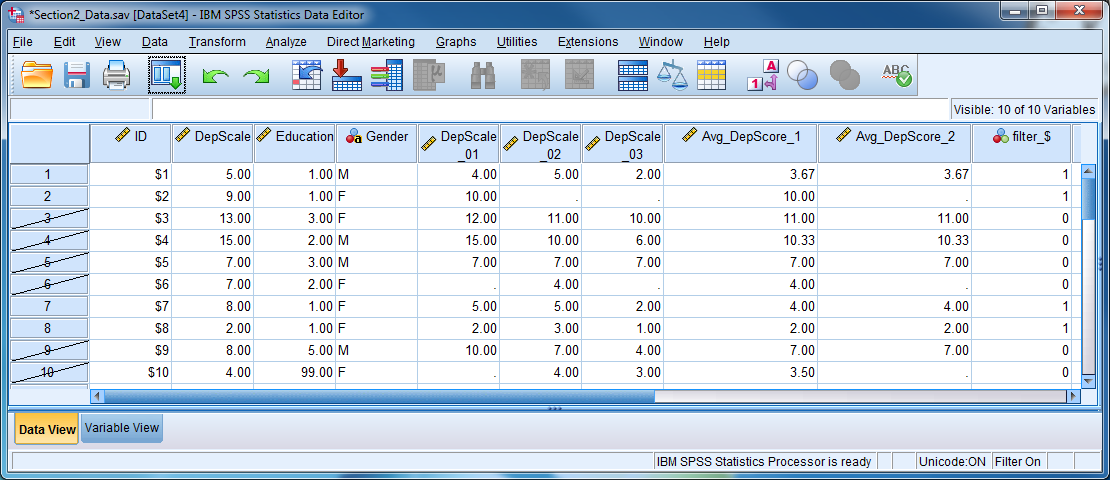
Selecting cases involves turning on a filter that handles the inclusion of certain cases and the exclusion of others. When the filter is on, analyses or summaries will only use the selected cases. There will be a message “Filter On” at the bottom right of the Data Editor window whenever SPSS is using only selected cases.
The first time you invoke the “Select Cases” procedure, the software creates a variable called filter_$ in the data set. This variable is equal to 0 for excluded cases and 1 for included cases. SPSS deletes and then re-creates the filter_$ variable each time you run “Select Cases”.
Users can specify their own filter variable. He or she can use any variable as a filter as long as a value of 0 for that variable indicates exclusion and a value of 1 inclusion. Click the “Use filter variable” option under Data -> Select Cases to do this; move your filter variable into the box.
3.2.1 If Condition is Satisfied
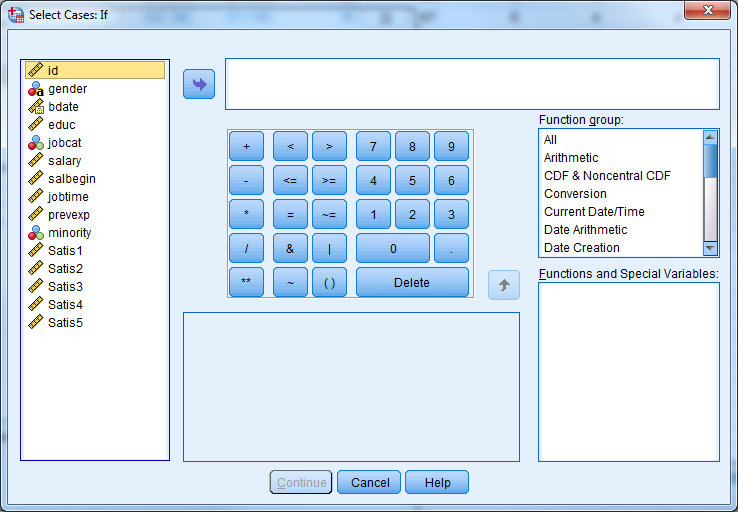
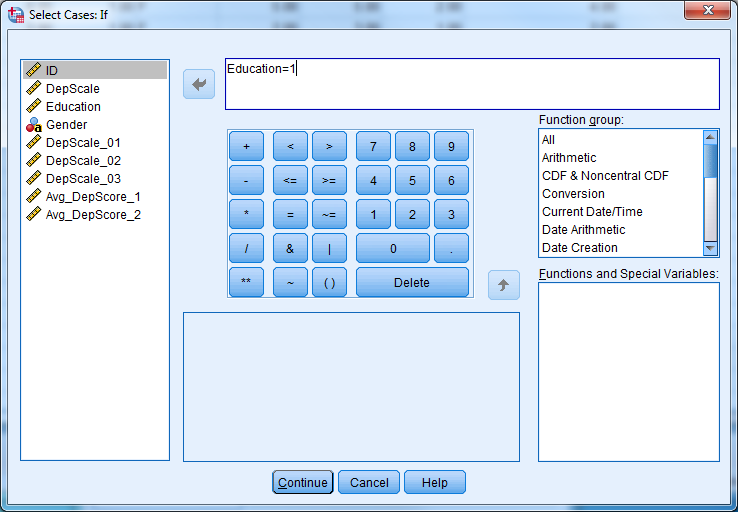
Go to Data -> Select Cases to use only some of the cases. Click “If condition is satisfied….” to select cases based on certain criteria. Then click the “If…” button to pull up a window in which you will state the condition. Some example conditions are:
gender = 'm'- selects men onlyage <= 12 and sex = 2- selects children 12 and under of one sex onlymarital = 0-selects all never married respondents
You can return to the data editor by clicking “Continue” and “OK”. Notice that certain rows have been “scratched” out by SPSS. SPSS has filtered out these cases because they did not satisfy the specified condition. Analyses will only use those cases that are not scratched out.
To return to the entire sample, go to Data -> Select Cases, choose the radio button next to “All Cases,” and then click “OK”. The “Filter On” message will disappear and all results from that point on refer to the entire data set.
3.2.2 Randomly Selecting Subsets
You may examine a randomly selected portion of the data by clicking “Random Sample of Cases” in the “Select Cases” window. Then click the “Sample…” button. You can then give an approximate percentage. If you want to take an exact number of cases, first determine the total number of cases (rows) and place this number in the “from the first --- cases” segment of the dialogue box. If you would like to take a precise number of cases from, say, all women, or all children under twelve, then sort the data first so that the cases of interest occupy the first rows. Determine the last row that refers to a female, or to a child under twelve, and proceed as above.
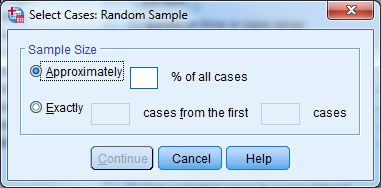
Note: When SPSS selects cases randomly, repeated selections will be different even when everything specified by the user has stayed the same. An approximate 30% sample of cases will result in a different 30% each time the user repeats the procedure.
Helpful Hint: To use the same random selection of cases over and over again, first take the initial random sample. Then re-name the filter_$ variable to any name of your choosing. SPSS will leave the variable alone, and you can re-use the filter in consecutive SPSS sessions.
3.2.3 Output Options
At the bottom of the “Select Cases” dialogue box are three options:
- Filter out unselected cases (recommended)
- Copy selected cases to a new dataset (recommended)
- Delete unselected cases (NOT RECOMMENDED)
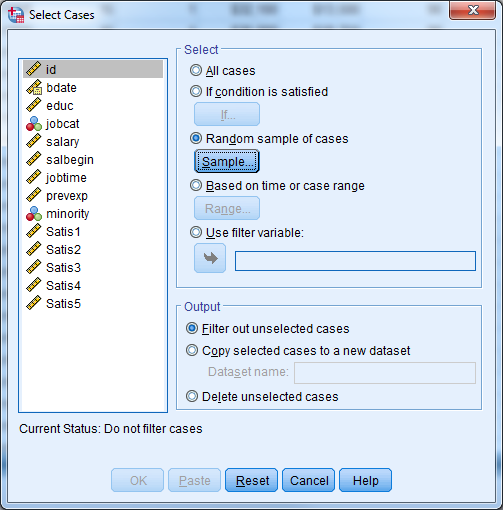
If you set this to “Filter out unselected cases”, the unselected cases remain in the data set but the software temporarily excludes them from all analyses. If you choose the second option, SPSS copies the selected cases to a new dataset and you can save the dataset on your disk by assigning a file name. The content of your original dataset remains untouched with these two options.
If the you change the option to “Delete unselected cases”, unselected cases disappear from the data entirely. Be careful when permanently deleting cases, because you CANNOT undo the deletion. Make sure to first save your data file under a different name if you wish to permanently delete cases.
Try it: Use section3_data.sav. Select only observations with Education = 1 for analysis.
3.3 Analyzing Groups of Data Separately
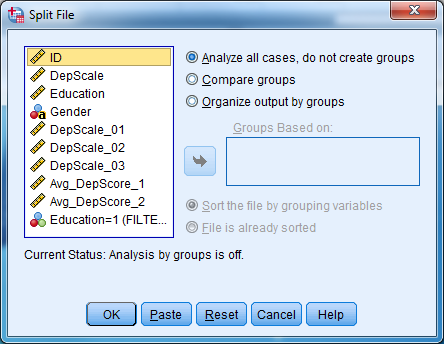
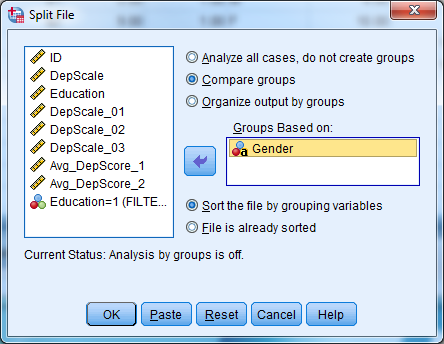
When analyzing groups of cases separately, such as men and women, the Split File command spares you from having to repeatedly select different groups of cases.
The Split File command first sorts the data into groups based on a specified variable. After that, SPSS generates any requested output for each group separately. If we split the file based on gender and then request the mean current salary, we would receive a mean current salary for men and a mean current salary for women. A flag at the bottom right of the data editor will read “Split File On” when you are using this option.
You can use multiple variables to divide the data. If you use both gender and job category as grouping variables, for example, then SPSS will give all output for each job category group within each gender.
To use Split File:
- Go to Data -> Split File.
- Click on “Compare Groups” or “Organize Output by Groups”.
- Select variable(s) which divide the data into groups.
- Click OK.
- To turn off the Split File command, return to Data -> Split File and click on “Analyze all cases, do not create groups”.
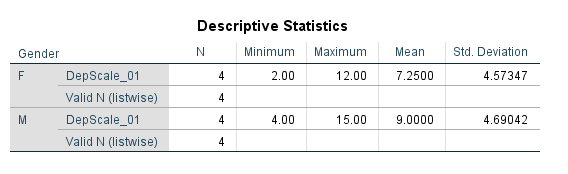
Try it: Use section3_data.sav. Obtain the descriptive statistics for DepScale_01 for males and females separately. Hint: Select Analyze -> Descriptive Statistics -> Descriptives.
3.4 Exercise 5 – Subsetting Data
Open exercise5_data.sav.
Select male managers. What is their average age?
(You can obtain the average age by choosing Analyze -> Descriptive Statistics -> Descriptives and moving “Age of Respondent (age)” to the right hand side.)
Use the “Split File” procedure to get the average age for each job category.
3.5 Merging Files
3.5.1 Adding Cases
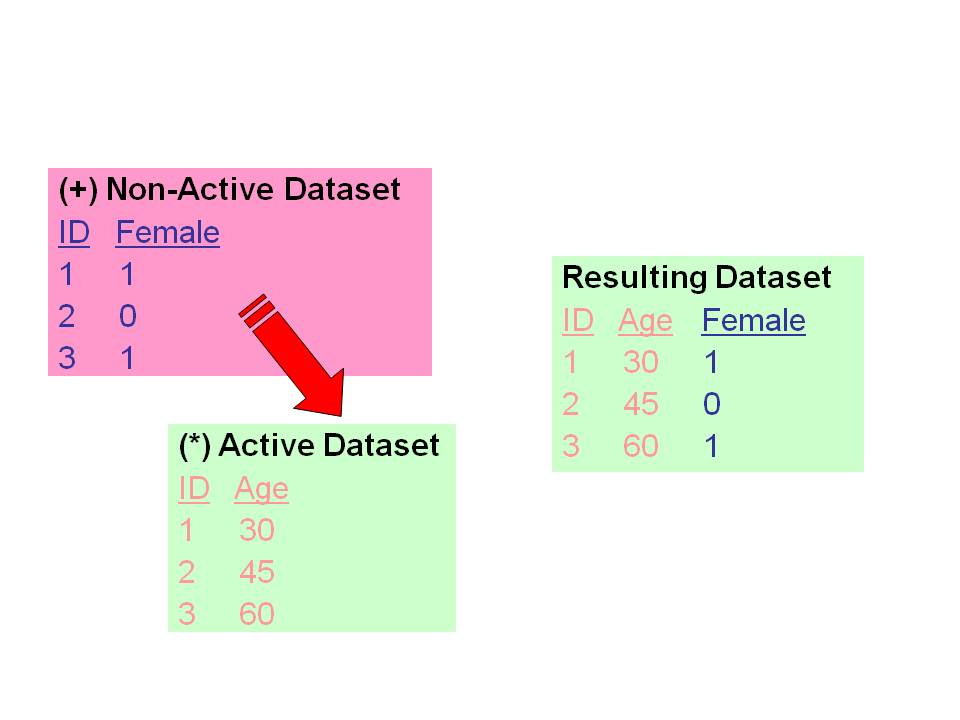
Suppose you have two files containing data on different cases, in which many of the variables are the same in name and format. You can merge these files together using the Add Cases command.
To merge the files, the basic steps are:
- Open the first data file.
- Go to Data -> Merge Files -> Add Cases.
- Find and select the second file, containing the additional cases.
- Choose variables to be included in the resulting file.
- Click OK.
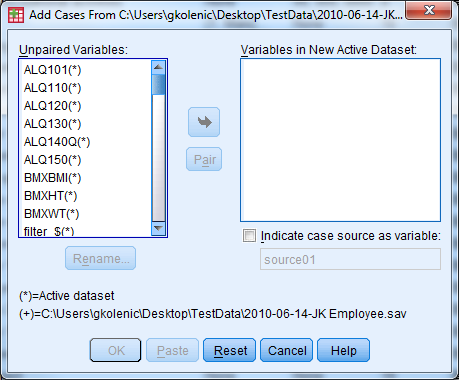
Inside the Add Cases dialogue window, one variable box on the right will have label “Variables in New Active Dataset”. Any variable listed in this box exists in both files under the same name, and will automatically be included in the resulting data set.
Variables listed in the left box are those that SPSS was not certain what to do with. They may appear in only one data set, or the variables in the two data sets may be named slightly differently. One data set we might use the variable number “sex” and the second the variable name “gender”, for example.
Variable names might come from the active data set or from the external file. SPSS indicates the origin of the name by assigning these symbols:
- the current (working) data file:
* - the second (external) data file:
+
When a variable exists in only one data file, and it is not simply a matter of mismatched names, simply move the variable into the right-hand box. The variable will exist in the resulting merged file and will have only missing values for one group of cases.
If two variables have different names, on the other hand, then select both variable names and click the “Pair” button. Before pairing them, you may want to rename one of the two to match the other; simply select the one whose name you would like to change and click “Rename”. If you do not use the Rename option, the software will use the name from the current working data file.
The last option is the box labeled “Indicate case source as variable”. If you check this box, you can specify a name for a variable in the new file that will indicate the file that the case came from.
SPSS sets up the new variable as follows:
- 0 indicates the case came from the currently open data set
- 1 indicates that the case is from the external (2nd) data set
3.5.2 Adding Variables
Suppose that we have files containing the same subjects, but different information. If we want to combine all the information into one new file, we want to add variables to one of the files.
Before actually using the “Add Variables” procedure, which is found under Data -> Merge Files -> Add Variables, there are certain prerequisites that SPSS is very insistent upon:
- Both files must contain a key “matching” variable, usually ID, which will be the basis for linking up each row of data.
- This key matching variable must be of the same type, including the same length. Preferably, it should have the same name.
- Each data file must be sorted in ascending order based upon the key matching variable. Save each file in its sorted form.
Note: it is NOT necessary to have exactly the same cases in both files.
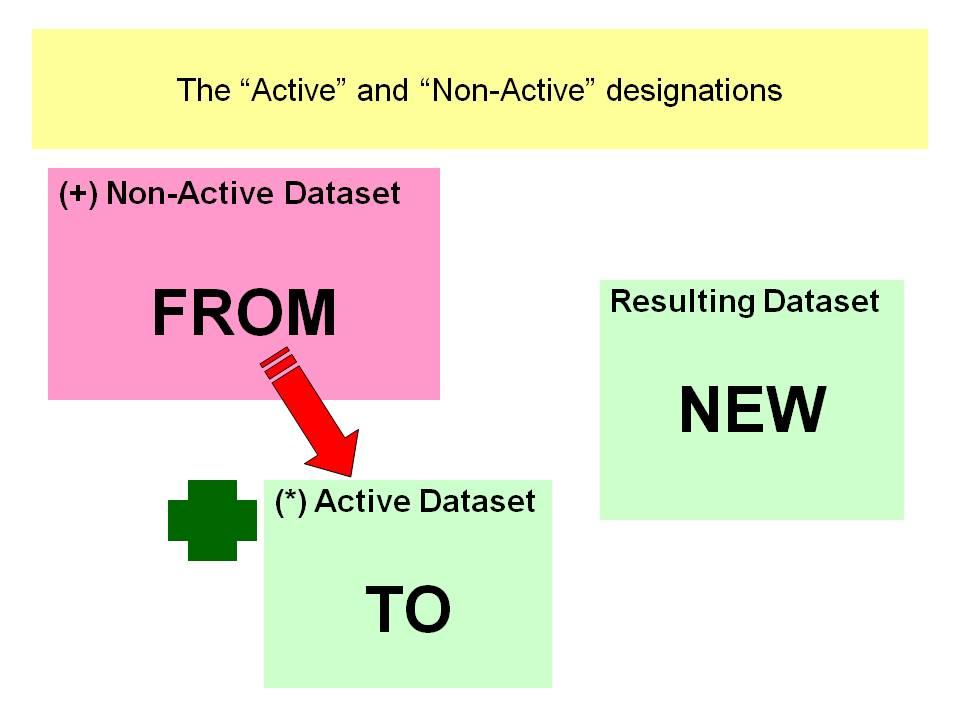
If all of these conditions are met, we can proceed with the Add Variables procedure. The first step is to identify the external file that we will obtain the new variables from. SPSS identifies variables as follows:
- from the working, or current, data file:
(*) - from the second, or external, data file:
(+)
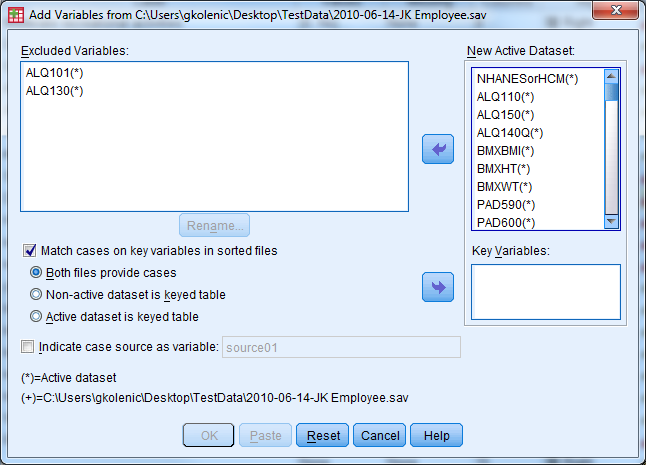
There are two locations where we can find variable names in the Add Variables dialogue box. The right box, labeled “New Active Dataset:”, lists the variables from the external dataset to include, and the left lists the excluded variables. The excluded variables are those which were found in both files. If the same variable is in both files, SPSS isn’t sure which one to accept in the resulting file, since there cannot be duplicate variable names. It will exclude one of the two variables.
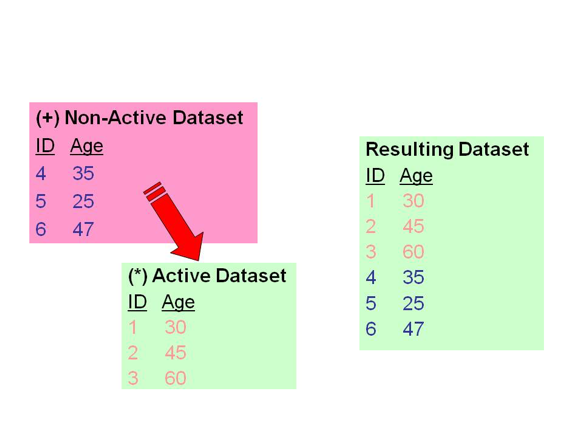
Click the box marked “Match cases on key variables in sorted files”. Next, find the ID variable from either data file, and move it into the “Key Variables” box. If the ID variables have different names, then first rename the variables so that they match.
There are three options underneath the box marked “Match cases on key variables in sorted files”. The options which include the phrase “keyed table” typically refer to merging with aggregated datasets. If the data file that is being merged into the working data file has at most one record per value of the key variable(s), then use the option “Non-active dataset is Keyed Table” in most cases.
There are two things to understand about applying aggregate data:
- The key matching variable is the one that identifies each aggregate case.
- The phrase “keyed table” refers to the aggregate data set.
SPSS uses the key variable to go to the aggregate data set, look up the information for that group (e.g., job category), and take that information back to each and every individual in that group in the original data file. For that reason, SPSS sees the aggregate data set as a reference table, which of course includes the key variable that attaches the appropriate information to the individuals.
If you begin in the individual data set, go to Add Variables and proceed as if both files have individual data. Then select the “Non-active dataset is keyed table” option, notifying SPSS that the external file is really nothing more than a reference table from which to obtain information for each individual case. If you begin in the aggregate data set, which typically has fewer rows, then select “Active dataset is keyed table”.
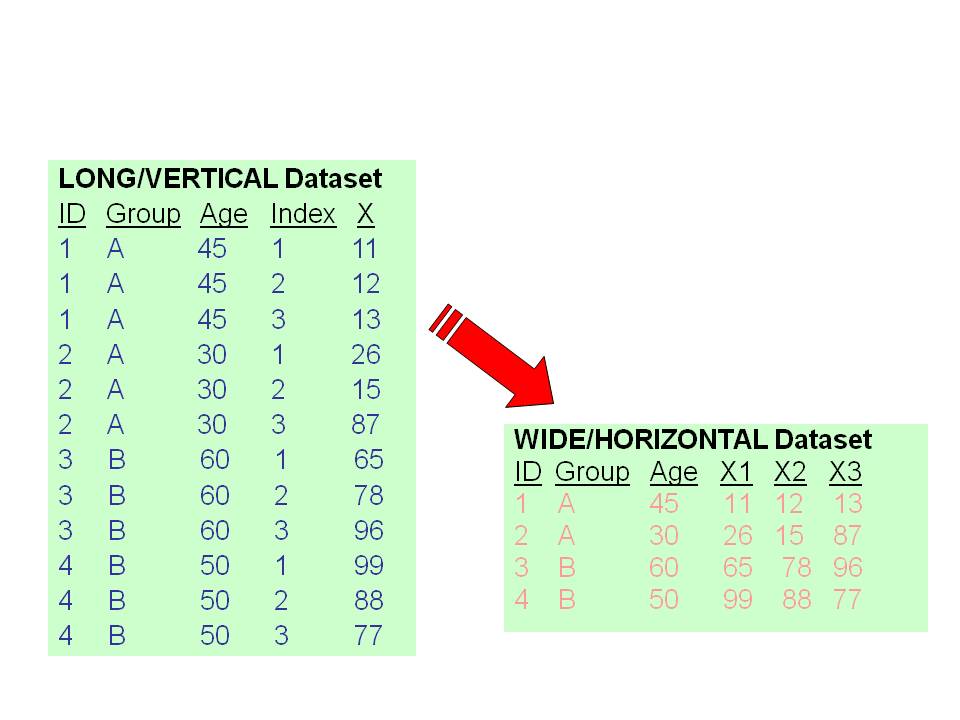
3.6 Converting Data Formats
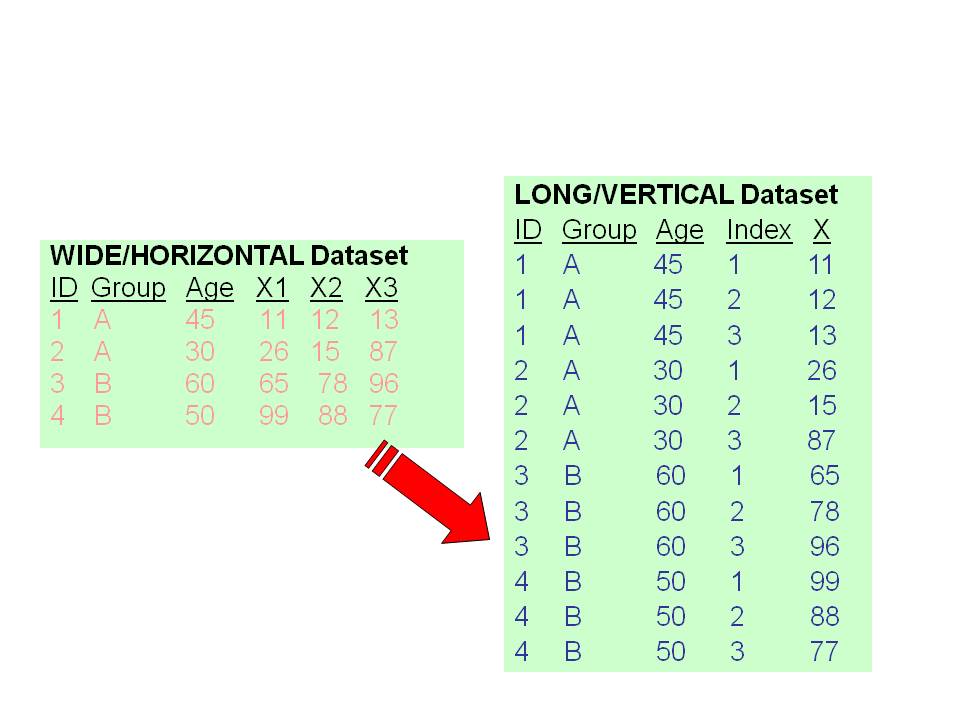
Different statistical methods frequently require different data formats. A repeated measures analysis of variance, for example, requires that data be in Wide format, while a linear mixed model requires that the data be in Long format. SPSS makes it easy to convert between the two formats. The examples below demonstrate how to use the wizard in SPSS.
To convert a dataset from one format to the other, first select “Data” and then “Restructure”. SPSS uses terminology that differs from conventional phrasing.
- Wide to Long Variables into Cases
- Long to Wide Cases into Variables
We will briefly discuss these two variations, before doing exercises together which include the instructions.
3.6.1 Wide to Long (AKA “Variables into Cases”)
There are seven steps in this Wizard:
- Identify the restructuring plan to be from “Variables into Cases”.
- Select the number of variable groups.
- Select variables.
- Create index variables (usually one).
- Create one index variable.
- Choose options.
- Finish.
3.6.2 Long to Wide (AKA “Cases into Variables”)
There are five steps in this Wizard:
- Identify the restructuring plan as “Cases into Variables”.
- Select variables.
- Sort the data.
- Choose options.
- Finish.
3.7 Exercise 6 – Restructuring I (Wide to Long)
Convert exercise6_data.sav from “Wide” format to “Long” format
3.8 Exercise 7 – Restructuring II (Long to Wide)
Convert exercise7_data.sav from “Long” format to “Wide” format
(Both exercises to be done together.)